Seven days of level, ramp, and closure forecasting for dock owners, plus water temp and dock-line warnings, rebuilt every hour from the same gauges LCRA reads.
Between LCRA gauges, USGS river flows, floodgate operations and county orders, the real picture is scattered across a dozen pages. Dock Watch reads all of them and tells you the one thing you actually want to know.
A wall of water on the Pedernales or Llano can lift the lake feet in a day. See it coming, and check your lines before it does.
A summer drawdown strands low-water ramps and trailers. Know which ramps still float before you hitch up.
County closures and no-boating reaches change week to week. Dock Watch surfaces them the moment they post.
Built for the dock, not the newsroom. Every number is measured or modeled, and it reconciles with LCRA's own reports.
Where the lake sits now, where it's headed, and the band around it, with a plain-English note on what changed overnight.
Live status for every public ramp, plus county closure orders folded right in, so a ramp under a closure never reads "open." See it in the tour below.
When the lake tops full pool or debris is moving, a dock-focused banner tells you what to check.
The real surface temperature from the Mansfield Dam buoy, plus wind and the week's peak gust.
A five-week crowd calendar that blends weather, holidays, closures and flood conditions.
Every tab, pulled straight from the live app. Swipe between them on your phone; it all refreshes on its own.
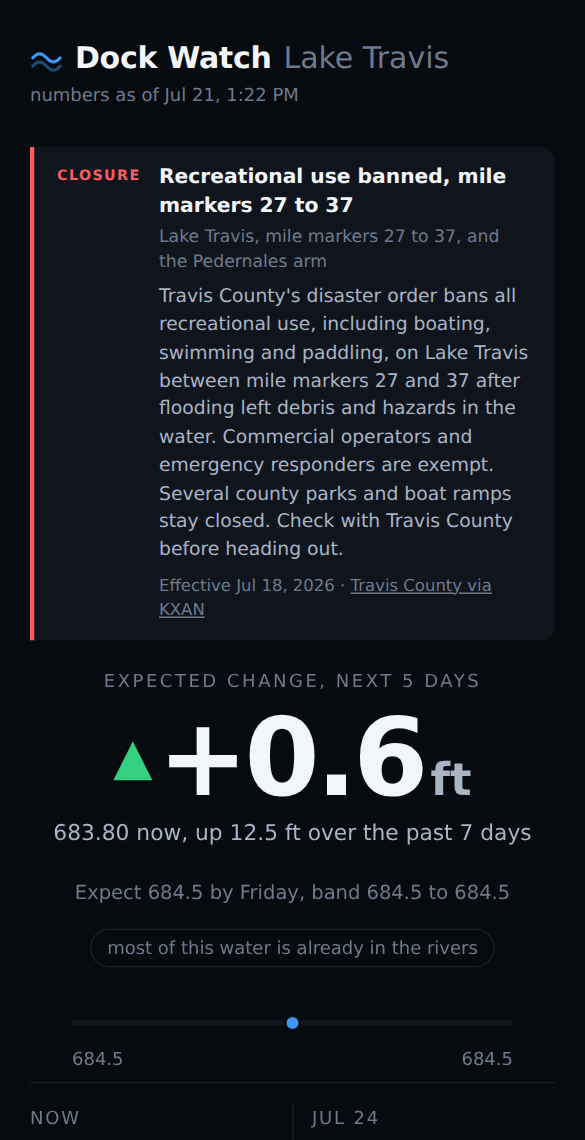
Level now, the seven-day projection, and what changed overnight.

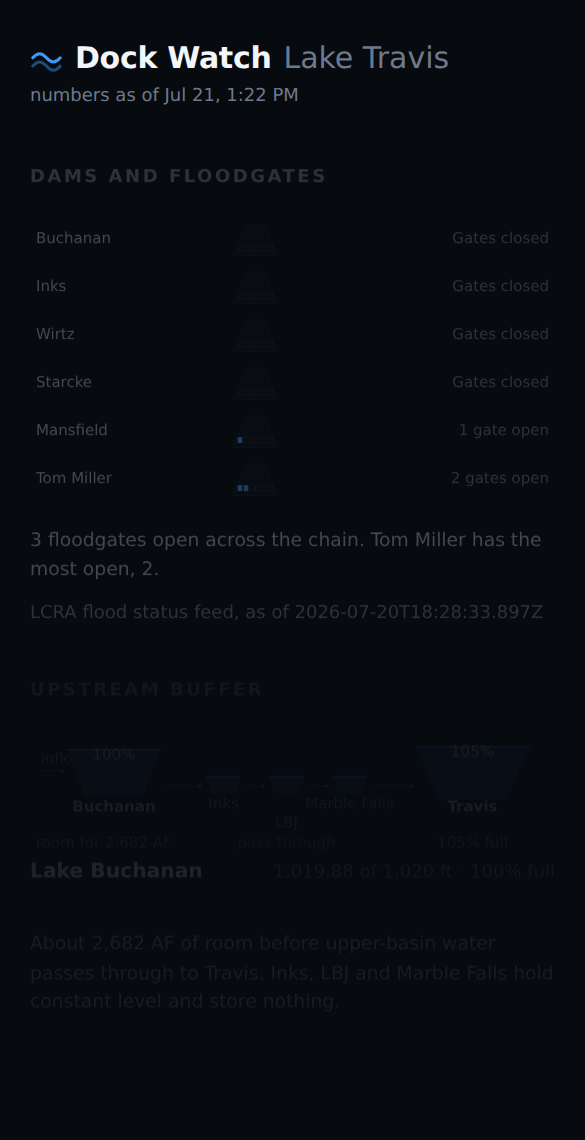
Where the water is coming from: basins, rivers and radar rain.
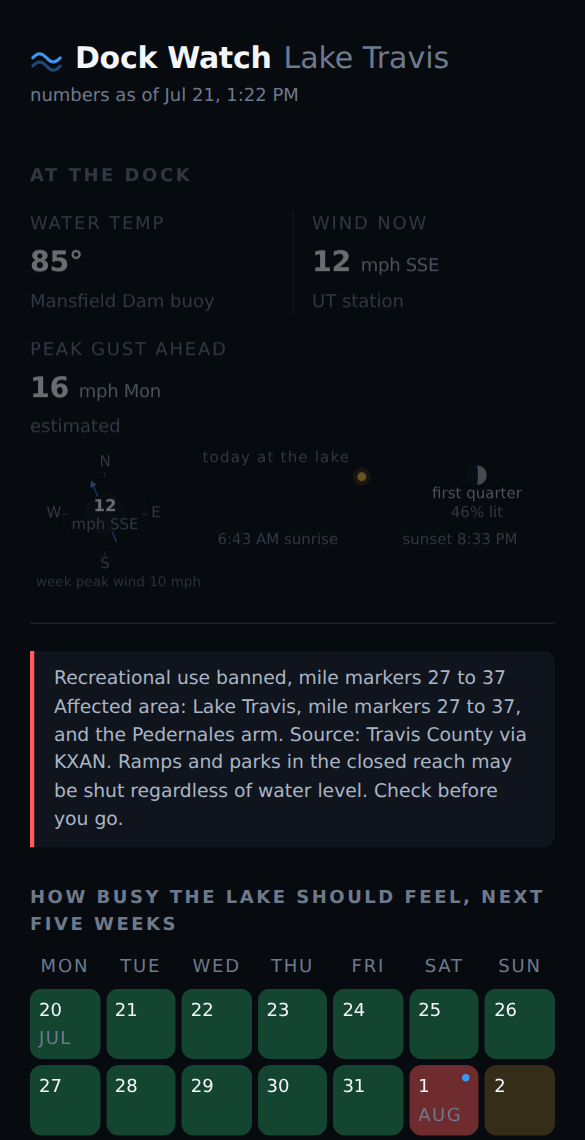
Dock-care alerts and how busy the lake will feel, five weeks out.
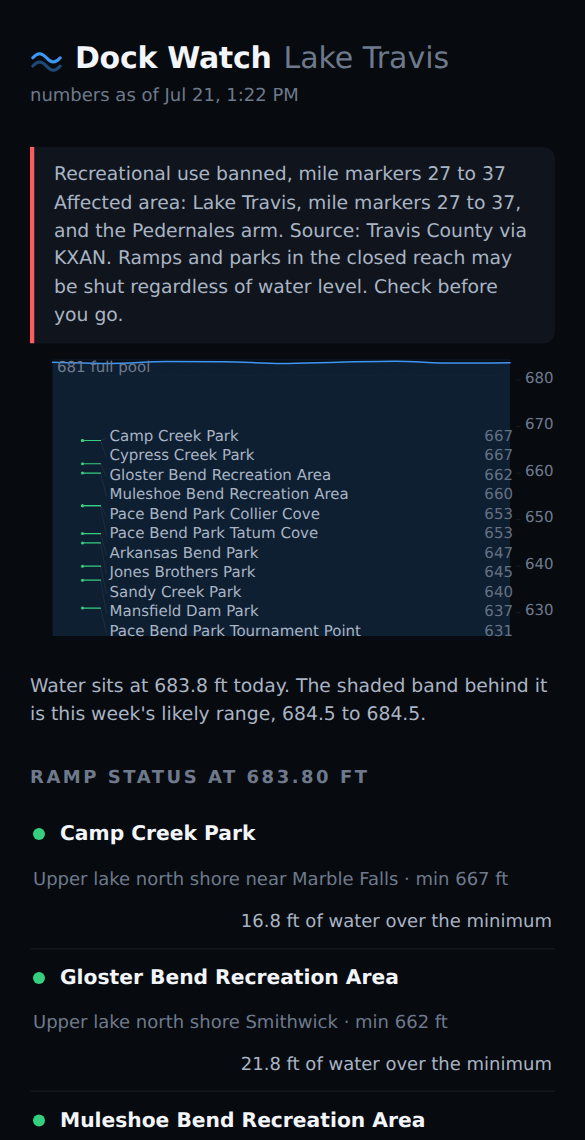
Live status for every public ramp with county closures, plus marina fuel, pump-out, rentals and hours by shore.
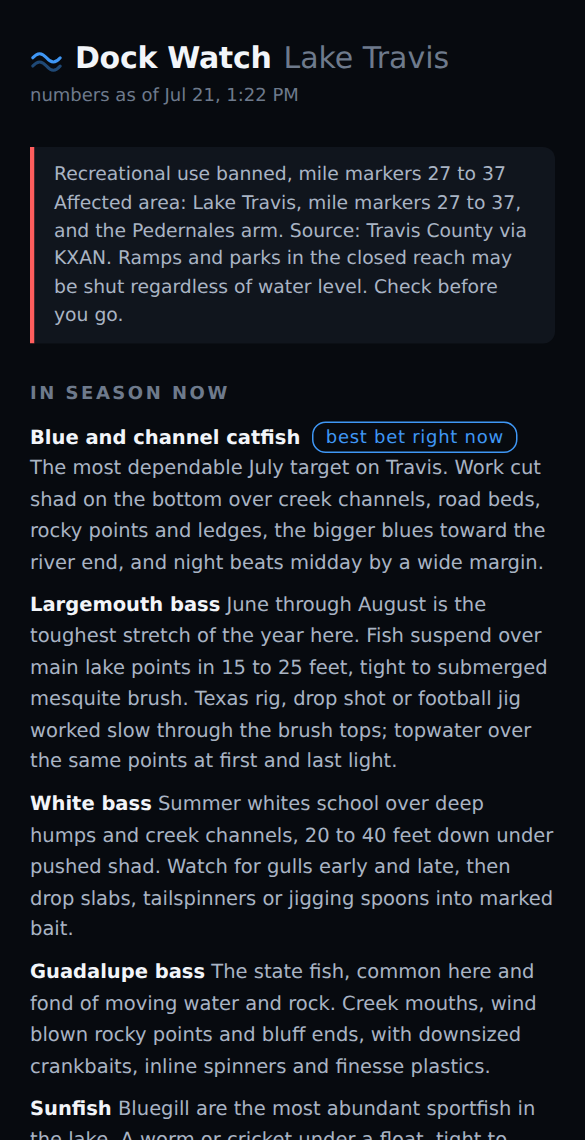
What's biting and where, keyed to the level and water temp.
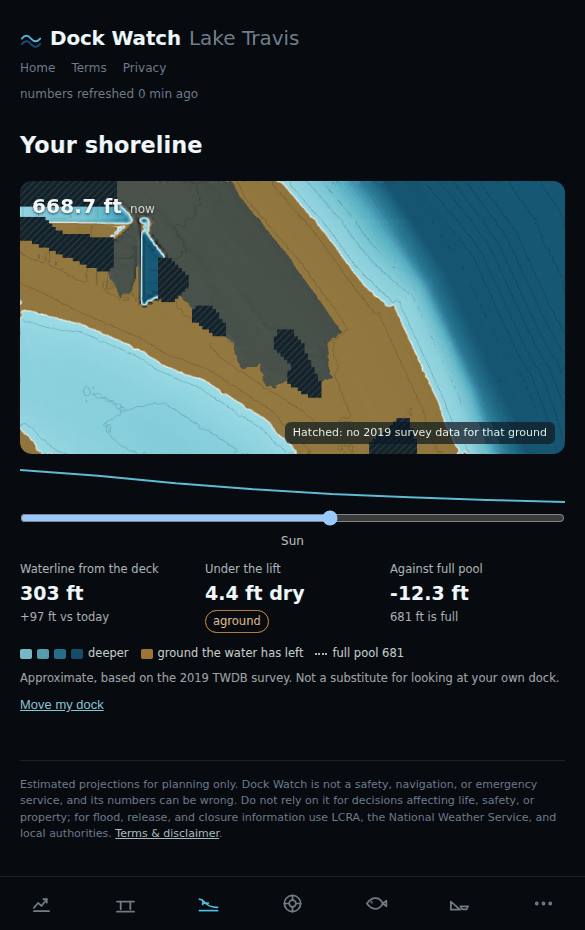
Your own cove drawn from the 2019 lakebed survey: how far the water sits from your deck, and how deep it is at the end of your dock, every day of the week ahead.
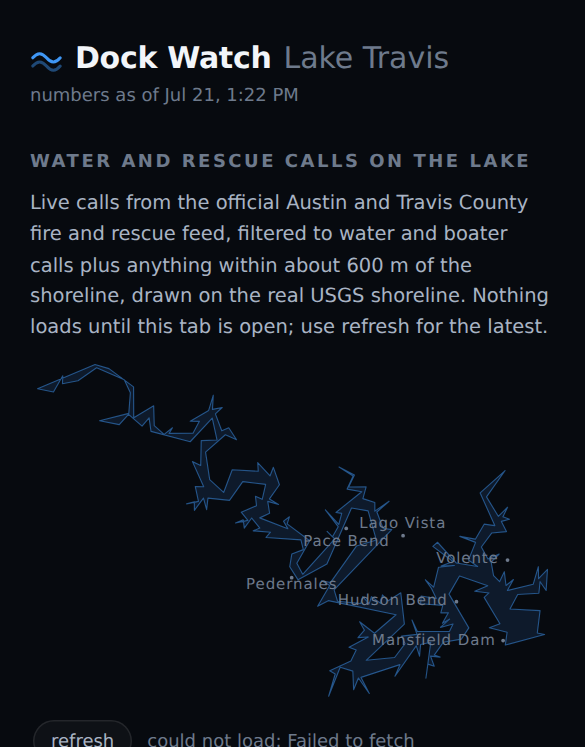
Live water-rescue calls near the shoreline, on the real lake map.
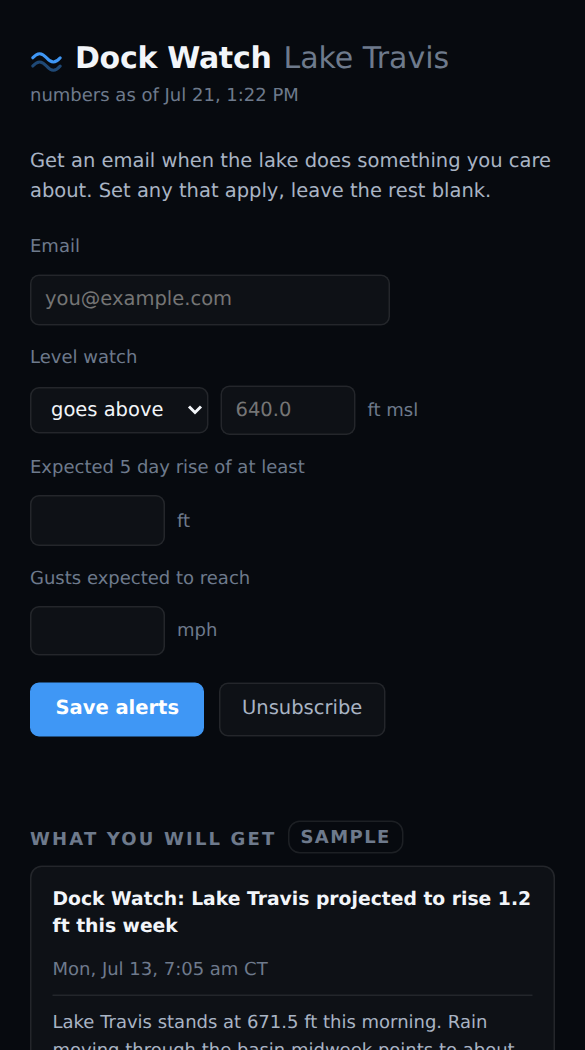
Set the levels that matter to you and get a heads-up.
LCRA Hydromet, USGS river gauges, NOAA rainfall radar and the county's closure notices, every hour, automatically.
Routes measured river flow and forecast rain into a seven-day projection, capped for floodgate releases.
The page refreshes its own numbers between builds, so what you open is current, with no app to update.
Neighbors on the water, in their own words.
"I saw the rise coming Thursday, moved my lines that night, and spent Saturday on the water instead of under the dock."
"Worth it for the ramp status alone. I've towed a boat to a closed ramp twice in my life. Not a third time."
"During the July flood the crest call was ahead of everything else I follow. That's what sold me."
Try everything for a week. Keep it for less than the cost of one bag of dock hardware a year.
One email when a flood event or closure starts on Lake Travis. No card, unsubscribe any time.
Everything: the complete dashboard, every tab, refreshed hourly, for a full 7 days. It's the real product, not a limited demo.
No. Nothing is charged until the trial ends. Cancel anytime before then and you won't pay a cent.
It's built from the same LCRA and USGS gauges the official river reports use, and it reconciles with them. It's an informed projection, not a guarantee; see the note below.
No. Dock Watch runs in your browser and works great saved to your phone's home screen. There's nothing to update.
Anytime, in one click. You keep access through the end of the period you've paid for.
Dock Watch is an informational tool for planning around Lake Travis conditions. It is not an emergency, life-safety, or navigation service, and it should never be relied on for those decisions. In an emergency, or for official guidance, follow LCRA, the National Weather Service, and Travis County directly. Data from USGS, NOAA/NWS and LCRA.